Class of 2021 Waitlist Notification Dates and Stats
For those of you that have been waitlisted at one of your top choices, here’s a list of 2016 waitlist statistics for several popular private and public schools, along with notification dates and latest status where available.
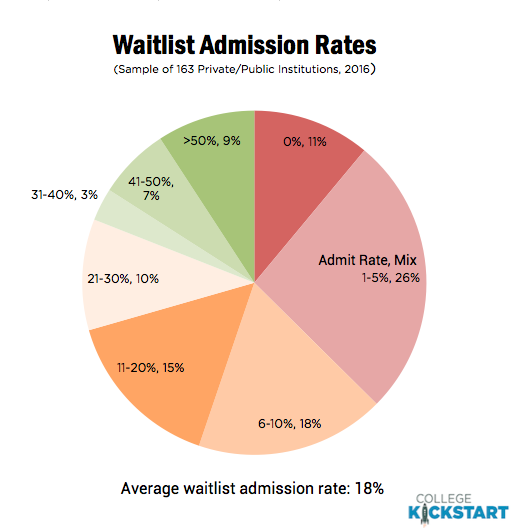
Our sample of waitlist statistics from 163 private and public institutions paints the following picture:
- On average, 18 percent of students accepting a place on a waitlist were admitted
- 55 percent of the schools admitted 10 percent or less of the students accepting a place on the wait list last year
- 37 percent of the schools admitted 5 percent or less
- 11 percent admitted no one
There are several factors driving the low rates, including the size of the waitlist (often very large), and how well a school anticipates its admissions yield.
Click Continue Reading for the list.
Class of 2021 Waitlist Notification Dates and 2016 Statistics
College Kickstart LLC
| Institution | Waitlist Offered (2016) | Waitlist Accepted (2016) | Waitlist Admitted (2016) | Admit Rate (2016) | Notification Date | Link |
|---|---|---|---|---|---|---|
| American | 3,116 | 501 | 0 | 0% | by 5/15 | Link |
| Amherst | 1,269 | 582 | 3 | 1% | Link | |
| Barnard | 1,615 | 1,340 | 59 | 4% | beginning 2nd week of May at earliest | Link |
| Bates | 1,063 | 334 | 49 | 15% | typically early May - late June, no later than August 1 | Link |
| Bennington | 262 | 255 | 182 | 71% | ||
| Boston College | 5,689 | 3,178 | 112 | 4% | closed 6/9 | Link |
| Boston University | 4,107 | 2,308 | 0 | 0% | ||
| Bowdoin | by 7/31 | Link | ||||
| Brandeis | 1,478 | 502 | 89 | 18% | ||
| Brown | 0 | by 6/30 | Link | |||
| Bucknell | 2,592 | 892 | 65 | 7% | ||
| Cal Poly SLO | 1,011 | 675 | by 5/15 | Link | ||
| Caltech | 636 | 468 | 8 | 2% | ||
| Carleton | 1,366 | 533 | 2 | 0% | ||
| Carnegie Mellon | 3,809 | 1,942 | 7 | 0% | by 6/1 (priority waitlist candidates first); no waitlist for Engineering, Architecture/Art/Design,Dietrich, IS, Mellon, SCS, Tepper | Link |
| Case Western | 9,293 | 4,732 | 333 | 7% | ||
| Claremont McKenna | 1,137 | 668 | 5 | 1% | ||
| Clemson | 1,794 | 659 | 3 | 0% | mid-May | Link |
| Colby | 1,864 | 650 | 61 | 9% | Link | |
| Colgate | 1,520 | 780 | 32 | 4% | by 8/1 | Link |
| Holy Cross | 1,074 | 459 | 14 | 3% | Link | |
| William & Mary | 4,115 | 2,037 | 154 | 8% | in progress, status mid-June, decision by 8/1 | Link |
| Colorado College | 784 | 213 | 21 | 10% | most by mid-May, some as late as June | Link |
| Colorado School of Mines | 1,427 | 111 | 9 | 8% | by 5/21 | Link |
| Connecticut College | 1,875 | 915 | 61 | 7% | Link | |
| Cornell | 4,571 | 2,874 | 61 | 2% | Link | |
| Dartmouth | 2,064 | 1,194 | 16 | 1% | mid-May to 7/1 (highly unlikely due to strong yield) | Link |
| Dickinson | 810 | 238 | 29 | 12% | Link | |
| Emory (Emory) | 4,187 | 2,150 | 61 | 3% | notifications through mid-summer | Link |
| Emory (Oxford) | 1,557 | 808 | 2 | 0% | notifications through mid-summer | Link |
| F&M | 2,600 | 16 | end of April to end of May | Link | ||
| George Washington | 4,493 | 1,616 | 170 | 11% | ||
| Georgetown | 2,134 | 1,334 | 80 | 6% | expect 40 accepted from waitlist, 75 of 100 offered spot on waitlist remain, final answer by 6/30 | |
| Georgia Tech | 3,830 | 2,267 | 470 | 21% | by 6/1 | Link |
| Grinnell | 1,032 | 395 | 97 | 25% | ||
| Hamilton | 1,071 | 475 | 47 | 10% | ||
| Harvard | highly unlikely due to strong 2021 yield | Link | ||||
| Harvey Mudd | 528 | 342 | 12 | 4% | ||
| Haverford | 1,079 | 412 | 26 | 6% | ||
| Johns Hopkins | 2,387 | 1,412 | 112 | 8% | Link | |
| Kenyon | 2,579 | 971 | 15 | 2% | update after 5/1 | Link |
| Lewis & Clark | 1,374 | 404 | 61 | 15% | late April to mid-May | Link |
| Macalester | 430 | 338 | 148 | 44% | ||
| Middlebury | 1,316 | 561 | 7 | 1% | early May to mid-June | Link |
| Miami - Oxford | 3,327 | 954 | 16 | 2% | by 8/1 | Link |
| MIT | 437 | 437 | 26 | 6% | closed 5/10; 14 admitted | Link |
| NYU | 925 students admitted from waitlist as of 5/22, including 70 spaces for Spring admission. No space in Abu Dhabi, Shanghai, SPS, Nursing or GLSP. Final decisions by 8/1 | Link | ||||
| NC State | 2,552 | 427 | 247 | 58% | by 6/15 | Link |
| Northwestern | 2,752 | 1,760 | 9 | 1% | by 6/30 | |
| Oberlin | 1,700 | 878 | 151 | 17% | ||
| Occidental | 821 | 416 | 70 | 17% | ||
| Pomona | 990 | 608 | 26 | 4% | Link | |
| Princeton | 1,237 | 840 | 18 | 2% | ~50 offered as of 5/12 | Link |
| RPI | 4,139 | 2,420 | 4 | 0% | ||
| Rice | 2,088 | 1,497 | 1 | 0% | by 7/1 | Link |
| Saint Michaels | 225 | 53 | 14 | 26% | typically mid-June | Link |
| Scripps | 675 | 290 | 83 | 29% | beginning late May | Link |
| Skidmore | 2,011 | 480 | 7 | 1% | ||
| Smith | 897 | 432 | 1 | 0% | ||
| SMU | 2,010 | 862 | 40 | 5% | Link | |
| Stanford | 1,569 | 1,044 | 55 | 5% | by 7/1 | Link |
| Trinity College | mid-April to 7/1 | Link | ||||
| Tufts | update in May/early June | Link | ||||
| Tulane | 3,881 | 1,168 | 0 | 0% | by 6/1 | Link |
| UC Berkeley | 3,760 | 2,445 | 1,340 | 55% | by 6/1 | Link |
| UC Davis | 9,381 | 3,112 | 2,571 | 83% | by 6/30 | Link |
| UC Irvine | 8,366 | 4,503 | 835 | 19% | by 6/30 | Link |
| UCLA | by 6/1 | Link | ||||
| UC Riverside | 4,642 | 2,753 | 0 | 0% | by 6/30 | Link |
| UCSD | by 6/30 | Link | ||||
| UCSB | 5,830 | 3,252 | 1,351 | 42% | by 6/30 | Link |
| UCSC | 9,983 | 5,707 | 4,097 | 72% | by early June | Link |
| UChicago | early summer | Link | ||||
| UIUC | 2,846 | 2,092 | 350 | 17% | by early June | Link |
| UMass Amherst | 6,085 | 1,787 | 515 | 29% | beginning mid-May | Link |
| Michigan | 11,197 | 3,970 | 36 | 1% | by late June | Link |
| UNC - Chapel Hill | 3,986 | 2,024 | 86 | 4% | by 6/30 | Link |
| Notre Dame | 1,796 | 743 | 85 | 11% | mid-May to late June | Link |
| Oregon | 998 | 444 | 388 | 87% | by 6/16 | Link |
| U Richmond | 3,209 | 1,236 | 60 | 5% | 5/1 - 6/30 | Link |
| U Rochester | 2,935 | 1,468 | 87 | 6% | ||
| USD | 1,756 | 626 | 362 | 58% | Link | |
| Virginia | 4,987 | 2,871 | 360 | 13% | closed | Link |
| Vanderbilt | 71 | Link | ||||
| Vassar | 879 | 409 | 21 | 5% | early May to 7/1 | Link |
| Virginia Tech | 3,588 | 2,405 | 1,697 | 71% | by 7/1 | Link |
| Wake Forest | beginning early May | Link | ||||
| Washington and Lee | 1,529 | 652 | 48 | 7% | beginning late April | Link |
| Wellesley | 1,641 | 957 | 23 | 2% | 3rd week in May to 6/30 | Link |
| Wesleyan | 2,262 | 1,134 | 55 | 5% | by 6/30 | Link |
| Wheaton - MA | 487 | 112 | 1 | 1% | by 7/1 | Link |
| Whitman | 922 | 371 | 3 | 1% | ||
| Williams | 2,343 | 864 | 24 | 3% |