Class of 2022 Waitlist Notification Dates and Stats
For those of you that have been waitlisted at one of your top choices, here’s a list of 2017 waitlist statistics for several popular private and public schools, along with notification dates and latest status where available.
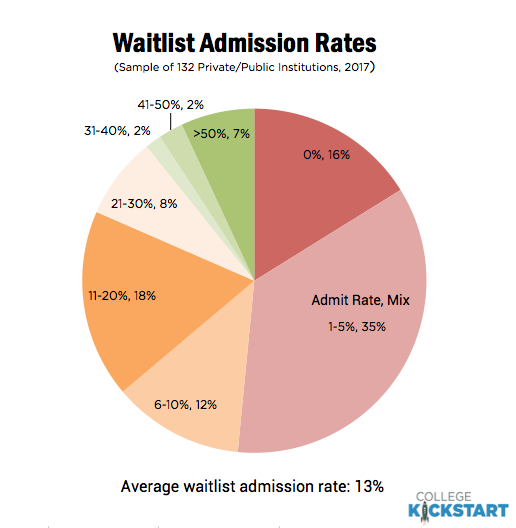
Our sample of waitlist statistics from 132 private and public institutions paints the following picture:
- On average, 13 percent of students accepting a place on a waitlist were admitted
- 63 percent of the schools admitted 10 percent or less of the students accepting a place on the wait list last year
- 51 percent of the schools admitted 5 percent or less
- 16 percent admitted no one
There are several factors driving the low rates, including the size of the waitlist (often very large), and how well a school anticipates its admissions yield.
Click Continue Reading for the list.
Class of 2022 Waitlist Notification Dates and 2017 Statistics
College Kickstart LLC
| Institution | Waitlist Offered (2017) | Waitlist Accepted (2017) | Waitlist Admitted (2017) | Admit Rate (2017) | Notification Date | Link |
|---|---|---|---|---|---|---|
| American | 4,049 | 609 | 0 | 0% | by 5/15 | Link |
| Amherst | 1,144 | 590 | 60 | 10% | Link | |
| Barnard | 1,703 | 1,222 | 51 | 4% | early May to early July | Link |
| Bates | 1,640 | 773 | 7 | 1% | typically early May - late June, no later than August 1 | Link |
| Boston College | 6,477 | 3,791 | 16 | 0% | by 7/1 | Link |
| Boston University | 4,399 | 2,584 | 7 | 0% | ||
| Brandeis | 1,826 | 668 | 8 | 1% | ||
| Brown | 86 | by 6/30 (2724 wait list offers extended) | Link | |||
| Bucknell | 2,883 | 1,301 | 55 | 4% | by 8/1 | Link |
| Cal Poly SLO | 3,168 | 15 | by 5/15 | Link | ||
| Caltech | 376 | 43 | 0 | 0% | ||
| Carleton | 1,315 | 521 | 41 | 8% | ||
| Carnegie Mellon | 5,609 | 2,834 | 4 | 0% | by 6/1 (priority waitlist candidates first) | Link |
| Case Western | 7,178 | 4,252 | 586 | 14% | ||
| Claremont McKenna | 723 | 404 | 1 | 0% | ||
| Clemson | 2,649 | 924 | 876 | 95% | mid-May | Link |
| Colby | 2,242 | 957 | 32 | 3% | late April - early May | Link |
| Colgate | 1,500 | 745 | 37 | 5% | ||
| Holy Cross | 1,109 | 444 | 0 | 0% | ||
| William & Mary | 4,392 | 2,355 | 69 | 3% | by 8/1, as of 6/22 all spaces appear to be full | Link |
| Colorado College | 763 | 212 | 16 | 8% | most by mid-May, some as late as June | Link |
| Colorado School of Mines | 391 | 82 | 10 | 12% | ||
| Columbia | Link | |||||
| Connecticut College | 1,260 | 543 | 48 | 9% | After 5/1 | Link |
| Cornell | 5,714 | 3,723 | 75 | 2% | As of 3/28: 6684 waitlist offers made | Link |
| Dartmouth | 2,021 | 1,345 | 0 | 0% | early May - end of June | Link |
| Davidson | 13 | 5/1 - 6/30 | Link | |||
| Dickinson | 628 | 252 | 35 | 14% | Link | |
| Duke | 92 | |||||
| Emory (Emory) | 4,277 | 2,992 | 41 | 1% | As of 5/18, not waitlist activity anticipated, formalized by 6/8 | Link |
| George Washington | 5,629 | 2,082 | 16 | 1% | 5/14: will not go to waitlist this year | Link |
| Georgetown | 2,473 | 1,571 | 50 | 3% | As of 5/18, only plan to admit waitlist students for School of Nursing and Health Studies | Link |
| Georgia Tech | 4,241 | 2,822 | 21 | 1% | by 6/1 | Link |
| Grinnell | 1,126 | 534 | 12 | 2% | ||
| Hamilton | 1,299 | 629 | 33 | 5% | ||
| Harvard | 6/30 (40-100 anticipated waitlist admits) | Link | ||||
| Harvey Mudd | 510 | 361 | 63 | 17% | ||
| Haverford | 1,152 | 483 | 37 | 8% | ||
| Johns Hopkins | 2,741 | 1,628 | 3 | 0% | majority after 5/1 | Link |
| Kenyon | 1,656 | 766 | 38 | 5% | update after 5/1 | Link |
| Lewis & Clark | 439 | 181 | 24 | 13% | late April to mid-May | Link |
| Macalester | 356 | 192 | 104 | 54% | ||
| Middlebury | 1,259 | 540 | 21 | 4% | early May to mid-June | Link |
| Miami - Oxford | 2,860 | 604 | 45 | 7% | by 8/1 | Link |
| MIT | 527 | 389 | 14 | 4% | 5/8: will not go to waitlist this year | Link |
| NYU | by 8/1, as of 6/4 200 students admitted off waitlist | Link | ||||
| NC State | 2,479 | 1,043 | 7 | 1% | by 6/15 | Link |
| Northwestern | 2,905 | 1,892 | 65 | 3% | ||
| Oberlin | 1,125 | 752 | 124 | 16% | ||
| Occidental | 1,088 | 482 | 0 | 0% | ||
| Pitzer | 675 | 287 | 24 | 8% | ||
| Pomona | 934 | 541 | 16 | 3% | Link | |
| Princeton | 1,168 | 826 | 101 | 12% | Link | |
| RPI | 4,803 | 2,662 | 22 | 1% | ||
| Rhodes | 1,008 | 214 | 51 | 24% | ||
| Rice | 2,080 | 1,328 | 17 | 1% | by 7/1 | Link |
| Saint Michaels | typically mid-June | Link | ||||
| Santa Clara | 2,397 | 1,479 | 39 | 3% | ||
| Scripps | 495 | 239 | 1 | 0% | beginning late May | Link |
| Skidmore | 2,300 | 461 | 60 | 13% | ||
| Smith | 931 | 471 | 19 | 4% | ||
| SMU | 1,423 | 582 | 69 | 12% | Link | |
| Stanford | 842 | 656 | 36 | 5% | by 7/1 | Link |
| Swarthmore | 44 | |||||
| Syracuse | 9,023 | 2,601 | 1,202 | 46% | ||
| Tufts | 1,504 | 635 | 0 | 0% | by early June | Link |
| Tulane | 5,596 | 1,672 | 0 | 0% | by 6/1 | Link |
| UC Riverside | 5,499 | 3,108 | 321 | 10% | by 6/30 | Link |
| UCSB | 6,650 | 4,000 | 960 | 24% | by 6/30 | Link |
| UCSC | 10,378 | 6,038 | 2,236 | 37% | by 6/30 | Link |
| Georgia | 889 | 531 | 31 | 6% | final decisions by 5/9 | Link |
| UIUC | 2,274 | 1,694 | 426 | 25% | by early June | Link |
| UMass Amherst | 6,736 | 1,557 | 44 | 3% | beginning mid-May | Link |
| Michigan | 11,094 | 4,109 | 468 | 11% | by late June | Link |
| UNC - Chapel Hill | 5,097 | 2,339 | 35 | 1% | closed 6/5 | Link |
| Notre Dame | 1,508 | 901 | 96 | 11% | mid-May | Link |
| Oregon | 134 | 79 | 73 | 92% | by 6/16 | Link |
| UPenn | 3,457 | 2,327 | 58 | 2% | ||
| URichmond | 3,383 | 1,281 | 56 | 4% | 5/1 - 6/30 | Link |
| U Rochester | 3,203 | 1,750 | 6 | 0% | ||
| USD | 1,913 | 896 | 3 | 0% | After 5/1 | Link |
| Virginia | 5,961 | 3,615 | 117 | 3% | As of 5/14, waitlist closed for all by Kinesiology program | Link |
| Vassar | 985 | 472 | 74 | 16% | early May to 7/1 | Link |
| Virginia Tech | 3,485 | 2,404 | 0 | 0% | by 7/1 | Link |
| Wake Forest | Link | |||||
| Washington and Lee | 1,634 | 737 | 32 | 4% | 5/8 update: waitlist closed | Link |
| Wellesley | 2,032 | 1,153 | 36 | 3% | 3rd week in May to 6/30 | Link |
| Wesleyan | 2,267 | 1,233 | 108 | 9% | by 6/30 | Link |
| Wheaton - MA | 96 | 17 | 5 | 29% | ||
| Whitman | 998 | 185 | 76 | 41% | ||
| Williams | 1,796 | 673 | 0 | 0% | ||
| WPI | 2,187 | 1,093 | 102 | 9% | ||
| Yale | 1102 offered place on waitlist | Link |