Waitlist Admission Rates and Notification Dates
 For those of you that have been waitlisted at one of your top choices, here's a list of waitlist statistics for several popular private and public schools, along with notification dates and links for more detail if available.
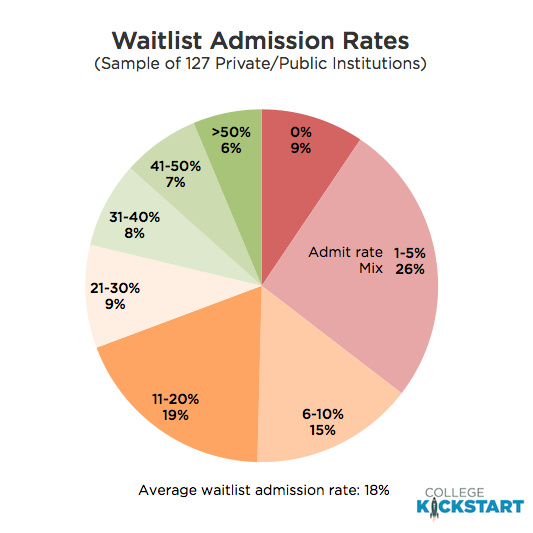
Our sample of waitlist statistics from 127 private and public institutions paints the following picture:
- On average, 18% of students accepting a place on a waitlist were admitted
- Half of the schools admitted 10% or less of the students accepting a place on the wait list last year
- 35% of the schools admitted 5% or less
- 9% admitted no one
There are several factors driving the low rates, including the size of the waitlist (often very large), and how well a school anticipates its admissions yield.
Click Continue Reading for the list.
Waitlist Admission Rates (2014-15) and Notification Dates
College Kickstart LLC
| Institution | Offered | Listed | Admitted | Admit Rate | Notification Date | Link |
|---|---|---|---|---|---|---|
| American | 1,252 | 73 | 24 | 33% | by 5/15 | Link |
| Amherst | 1,341 | 600 | 61 | 10% | Link | |
| Austin College | 12 | 6 | 0 | 0% | ||
| Barnard | 1,108 | 573 | 21 | 4% | beginning 5/15 | Link |
| Bates | 1,595 | 694 | 26 | 4% | early May - August 1 | Link |
| Beloit | 10 | 3 | 1 | 33% | ||
| Boston College | 4,695 | 2,542 | 210 | 8% | by 7/1 | Link |
| Bryn Mawr | 696 | 351 | 33 | 9% | ||
| Bucknell | 1,822 | 705 | 57 | 8% | ||
| Butler | 587 | 175 | 83 | 47% | ||
| Carleton | 1,275 | 371 | 9 | 2% | Link | |
| Carnegie Mellon | 3,104 | 1,630 | 73 | 4% | 5/6 for priority waitlist; 5/15-6/1 for regular | Link |
| Case Western | 8,493 | 4,670 | 792 | 17% | ||
| Centre College | 124 | 31 | 8 | 26% | ||
| Claremont McKenna | 614 | 349 | 38 | 11% | ||
| Clark | 651 | 232 | 90 | 39% | Link | |
| Colby | 1,400 | 662 | 31 | 5% | by mid-June | Link |
| Colgate | 1,707 | 766 | 56 | 7% | by 8/1 | Link |
| Holy Cross | 816 | 343 | 0 | 0% | Link | |
| William & Mary | 3,603 | 1,526 | 59 | 4% | status mid-June, decision by 8/1 | Link |
| College of Wooster | 567 | 83 | 19 | 23% | ||
| Colorado College | 874 | 198 | 24 | 12% | Link | |
| Colorado School of Mines | 1,800 | 136 | 6 | 4% | by 5/17 | Link |
| Connecticut College | 1,298 | 560 | 73 | 13% | Link | |
| Cornell | 3,143 | 2,026 | 96 | 5% | Link | |
| Dartmouth | 1,855 | 1,133 | 0 | 0% | mid-May to 7/1 | Link |
| Dickinson | 801 | 280 | 0 | 0% | Link | |
| Earlham | 241 | 237 | 93 | 39% | ||
| Elon | 3,193 | 1,265 | 208 | 16% | Link | |
| Fairfield | 1,690 | 429 | 15 | 3% | Link | |
| Franklin & Marshall | 1,385 | 411 | 76 | 18% | Link | |
| Furman | 197 | 42 | 17 | 40% | ||
| George Mason | 2,310 | 1,109 | 684 | 62% | ||
| George Washington | 3,770 | 986 | 113 | 11% | ||
| Georgetown | 2,188 | 1,301 | 114 | 9% | ||
| Georgia Tech | 3,900 | 2,150 | 174 | 8% | throughout May | Link |
| Gonzaga | 555 | 171 | 162 | 95% | ||
| Goucher | 56 | 40 | 8 | 20% | ||
| Grinnell | 1,532 | 602 | 70 | 12% | ||
| Hamilton | 919 | 438 | 21 | 5% | ||
| Hampshire | 241 | 90 | 27 | 30% | early May | Link |
| Harvey Mudd | 596 | 399 | 14 | 4% | Link | |
| Haverford | 831 | 368 | 5 | 1% | ||
| Hobart and Wm Smith | 763 | 189 | 21 | 11% | ||
| Ithaca College | 3,986 | 709 | 220 | 31% | ||
| James Madison | 3,684 | 1,987 | 166 | 8% | majority in June, as late as 8/1 | Link |
| Kalamazoo | 365 | 111 | 61 | 55% | ||
| Kenyon | 2,397 | 642 | 38 | 6% | Link | |
| Knox College | 52 | 8 | 1 | 13% | ||
| Lafayette | 1,827 | 464 | 37 | 8% | Link | |
| Lawrence | 101 | 95 | 33 | 35% | ||
| Lehigh | 3,691 | 1,296 | 2 | 0% | ||
| Lewis & Clark | 396 | 146 | 21 | 14% | ||
| Macalester | 510 | 269 | 215 | 80% | ||
| Marquette | 5,187 | 1,784 | 796 | 45% | Link | |
| Middlebury | 1,525 | 663 | 1 | 0% | mid-May to mid-June | Link |
| Mt. Holyoke | 440 | 268 | 4 | 1% | ||
| Muhlenberg | 1,759 | 370 | 19 | 5% | ||
| Northwestern | 2,767 | 1,587 | 55 | 3% | ||
| Occidental | 792 | 297 | 65 | 22% | ||
| Ohio State - Columbus | 1,397 | 239 | 239 | 100% | ||
| Pomona | 651 | 324 | 0 | 0% | ||
| Princeton | 1,138 | 818 | 41 | 5% | Link | |
| Providence | 1,936 | 602 | 163 | 27% | May | Link |
| Purdue | 1,215 | 1,208 | 368 | 30% | June | Link |
| Reed | 829 | 351 | 59 | 17% | ||
| RPI | 4,984 | 2,851 | 77 | 3% | ||
| Rhodes | 738 | 154 | 52 | 34% | Link | |
| Rose-Hulman | 379 | 131 | 2 | 2% | ||
| St. Lawrence | 94 | 21 | 11 | 52% | ||
| Saint Anselm | 351 | 134 | 7 | 5% | ||
| Saint Michael's | 182 | 51 | 0 | 0% | typically mid-June | Link |
| Saint Olaf | 562 | 467 | 75 | 16% | ||
| San Diego State | 4,126 | 1,945 | 47 | 2% | ||
| SCU | 2,463 | 1,337 | 71 | 5% | ||
| Sarah Lawrence | 546 | 156 | 24 | 15% | ||
| Scripps | 683 | 277 | 0 | 0% | mid-May | Link |
| Sewanee | 238 | 75 | 7 | 9% | 4/15 to 7/1 | Link |
| Skidmore | 1,692 | 385 | 0 | 0% | ||
| Smith | 656 | 362 | 79 | 22% | ||
| SMU | 1,345 | 476 | 98 | 21% | Link | |
| Southwestern | 92 | 10 | 5 | 50% | ||
| Spelman | 364 | 290 | 13 | 4% | ||
| Stanford | 958 | 695 | 7 | 1% | ||
| SUNY Geneseo | 560 | 92 | 10 | 11% | Link | |
| SUNY Stony Brook | 3,271 | 1,421 | 623 | 44% | June | Link |
| Stonehill | 474 | 164 | 79 | 48% | Link | |
| TCU | 1,236 | 416 | 64 | 15% | Link | |
| TCNJ | 1,715 | 520 | 238 | 46% | ||
| Trinity College | 1,766 | 664 | 16 | 2% | 4/15 to 7/1 | Link |
| Tulane | 2,774 | 705 | 327 | 46% | by 6/1 | Link |
| UC Berkeley | 3,375 | 2,143 | 437 | 20% | Link | |
| UC Davis | 6,352 | 2,177 | 12 | 1% | by 6/1 | Link |
| UC Irvine | 3,260 | 1,479 | 1,171 | 79% | ||
| UC Riverside | 4,474 | 2,608 | 276 | 11% | ||
| UC Santa Barbara | 3,956 | 2,332 | 152 | 7% | ||
| UC Santa Cruz | 3,655 | 1,320 | 0 | 0% | Link | |
| University of Denver | 1,547 | 499 | 74 | 15% | ||
| UMass Amherst | 5,228 | 1,403 | 26 | 2% | mid-May | Link |
| UMass - Lowell | 553 | 196 | 0 | 0% | ||
| Michigan | 12,631 | 4,457 | 91 | 2% | late June | Link |
| UNC - Chapel Hill | 3,154 | 1,563 | 31 | 2% | by 6/30 | Link |
| UPenn | 2,651 | 1,600 | 136 | 9% | ||
| Pitt | 2,492 | 572 | 289 | 51% | ||
| Puget Sound | 477 | 170 | 11 | 6% | ||
| URI | 1,452 | 457 | 10 | 2% | ||
| U Richmond | 3,621 | 1,466 | 12 | 1% | 5/1 - 6/30 | Link |
| University of San Diego | 2,028 | 772 | 51 | 7% | Link | |
| UT Austin | 769 | 213 | 18 | 8% | ||
| Vermont | 3,093 | 748 | 175 | 23% | by 6/1 | Link |
| Virginia | 5,543 | 3,456 | 42 | 1% | 5/7 - 6/30 | Link |
| Washington | 2,150 | 900 | 198 | 22% | ||
| Vanderbilt | 6,018 | 4,536 | 210 | 5% | beginning first week in May | Link |
| Villanova | 5,081 | 1,943 | 464 | 24% | ||
| VMI | 429 | 150 | 15 | 10% | ||
| Virginia Tech | 2,294 | 1,587 | 750 | 47% | by 7/1 | Link |
| Wabash College | 38 | 6 | 2 | 33% | ||
| Washington and Lee | 2,271 | 827 | 72 | 9% | beginning late April | Link |
| Wellesley | 1,182 | 687 | 85 | 12% | by 6/30 | Link |
| Wesleyan | 1,995 | 893 | 70 | 8% | majority in May, may extend to June | Link |
| Wheaton - IL | 449 | 149 | 64 | 43% | ||
| Wheaton - MA | 300 | 90 | 22 | 24% | by 7/1 | Link |
| Whitman | 862 | 315 | 59 | 19% | ||
| Willamette | 301 | 124 | 46 | 37% | ||
| Williams | 1,238 | 594 | 70 | 12% | ||
| WPI | 3,023 | 1,725 | 203 | 12% | between 5/1 and 6/1 | Link |
| Yale | 1,324 | 837 | 14 | 2% | Link |